What we do instead
Each player carries a range of his team's work, not a single number, and the share nobody on the list accounts for is published as unallocated.

The authorized GameTimePicks output for a game or player, frozen before the start and never edited afterwards. Each one is graded against the official result once the game is final, and results are published as games are graded. Player results grade the official player board's own pre-kickoff projections, each under the model and version that made it — the same projections the game pages and Weekly leaders show. The supporting simulations some game pages show are not graded in these results, so none of these results describe them.
13 scheduled · 13 with a report · 13 with a supported read
 BAL
 BUF(model favourite)
 TEN
 CIN(model favourite)
 ARI
 DAL(model favourite)
 MIN
 DET(model favourite)
 LV
 NYJ(model favourite)
 CLE
 PIT(model favourite)
 ATL
 TB(model favourite)
 IND
 JAX(model favourite)
 LAC
 LAR(model favourite)
 KC
 DEN(model favourite)
 NE(model favourite)
 MIA
 PHI(model favourite)
 WSH
 CHI
 SEA(model favourite)
Win chances add up to less than 100%: about 2–3% chance of a tie after regulation is not assigned to either team.
Model Performance. Our win chances come from a team rating that weights how decisively teams win. Tested on 4,281 past games it had never seen (2006–2021), it scored 0.629 on log loss (lower is better) — better than our previous rating's 0.642 and a coin flip's 0.693, but short of the sportsbooks' own odds at 0.610. It has NOT been shown to beat the sportsbook market. Where our win and margin ratings disagree on the favourite, the previous rating is used for that game. The 2026 season evaluation still runs under bars frozen in August, so every forecast stays experimental. These ratings are built from results, not from who is playing: they do not know that a starting quarterback has been ruled out. Our player projections do remove players who cannot play; the team win chance beside them does not. We tested whether adding that would help, using perfect hindsight about whether each team's main quarterback actually played — on 855 games from 2023 to 2025 it improved the win rating on average but was WORSE in one of the three seasons, so it did not clear the bar we hold these ratings to and we left the rating alone. Official Forecasts do not enter paper products (Bank Builder, Moonshot, Parlays) until the model clears its preregistered bar. Model Performance →
The full Week 8 · regular season: 13 of 13 carry a published simulation.
| Kickoff (ET) | Matchup | Likely winner | Projected score | Our total (range) | Sportsbook total | Weather | Status | |
|---|---|---|---|---|---|---|---|---|
| Sun 1:00 PM | BAL atBUF | BUF 70.8% | BAL 22 — 30 BUF | 52 (35–69) | — | 63°F · 3 mph wind from the S · 0% chance of rain · partly sunny | Simulated · 10,000 runs | View game → |
| Sun 1:00 PM | TEN atCIN | CIN 81.8% | TEN 18 — 28 CIN | 46 (29–63) | — | 68°F · 3 mph wind from the S · 40% chance of rain · chance light rain | Simulated · 10,000 runs | View game → |
| Sun 1:00 PM | ARI atDAL | DAL 65.5% | ARI 24 — 31 DAL | 55 (38–72) | — | 78°F · 5 mph wind from the SE · 1% chance of rain · partly sunny — the schedule carries no roof for this stadium, so this is the open-air forecast | Simulated · 10,000 runs | View game → |
| Sun 1:00 PM | MIN atDET | DET 56.9% | MIN 20 — 24 DET | 44 (27–62) | — | Indoors — roofed stadium, no weather to report | Simulated · 10,000 runs | View game → |
| Sun 1:00 PM | LV atNYJ | NYJ 55.7% | LV 20 — 24 NYJ | 44 (27–61) | — | 62°F · 3 mph wind from the SW · 0% chance of rain · partly sunny | Simulated · 10,000 runs | View game → |
| Sun 1:00 PM | CLE atPIT | PIT 65.5% | CLE 17 — 23 PIT | 40 (24–57) | — | 67°F · 3 mph wind from the S · 0% chance of rain · mostly cloudy | Simulated · 10,000 runs | View game → |
| Sun 1:00 PM | ATL atTB | TB 51.3% | ATL 22 — 24 TB | 46 (29–63) | — | 80°F · 13 mph wind from the E · 69% chance of rain · chance showers and thunderstorms | Simulated · 10,000 runs | View game → |
| Sun 1:00 PM | IND atJAX | JAX 76.5% | IND 20 — 27 JAX | 47 (30–64) | — | 75°F · 17 mph wind from the E · 36% chance of rain · chance showers and thunderstorms | Simulated · 10,000 runs | View game → |
| Sun 4:05 PM | LAC atLAR | LAR 74.3% | LAC 19 — 26 LAR | 45 (28–62) | — | Indoors — roofed stadium, no weather to report | Simulated · 10,000 runs | View game → |
| Sun 4:25 PM | KC atDEN | DEN 61.9% | KC 18 — 22 DEN | 40 (23–57) | — | 61°F · 6 mph wind from the ENE · 8% chance of rain · partly sunny | Simulated · 10,000 runs | View game → |
| Sun 4:25 PM | NE atMIA | NE 70.9% | NE 24 — 20 MIA | 44 (27–61) | — | 79°F · 14 mph wind from the E · 89% chance of rain · showers and thunderstorms | Simulated · 10,000 runs | View game → |
| Sun 8:20 PM | PHI atWSH | PHI 50.8% | PHI 24 — 23 WSH | 47 (30–64) | — | 55°F · 2 mph wind from the SE · 0% chance of rain · partly cloudy | Simulated · 10,000 runs | View game → |
| Mon 8:15 PM | CHI atSEA | SEA 65.5% | CHI 20 — 26 SEA | 46 (29–63) | — | 51°F · 1 mph wind from the N · 12% chance of rain · mostly cloudy | Simulated · 10,000 runs | View game → |
How to read this table. Likely winner is the team our model gives the higher win chance, and that chance. It comes from the model's team rating, not from counting wins in the 10,000 simulated games. Projected score is the middle of our simulated outcomes, not a call on the exact final; it adds up to our total and always leans toward the favourite, even by one point. Our total is the points we expect both teams to score combined, with the range where 8 in 10 simulations landed. Nothing here is a bet recommendation.
Before it was allowed on this page, our totals model was tested on 5,878 past NFL games (2000–2021) it had never seen. Its projected total missed the real combined score by 10.9 points on average; the sportsbooks' closing totals missed by 10.7. Game totals are hard to predict for everyone, so read any single total as the middle of a wide range.
Ours next to the sportsbooks’: Across these 13 games our projected totals run from 40 to 55 points. Real NFL scoring swings far more than that from game to game, so treat small differences between games as small.
Conditions are the forecast nearest kickoff, captured Oct 29, 7:55 PM ET. The model does not use them — no weather term enters the total or the win chance, and these are shown beside the forecast so you can see what it is not accounting for. Forecast: US National Weather Service (api.weather.gov), public domain. Schedule: nflverse (CC BY 4.0). Coordinates: © OpenStreetMap contributors (ODbL).
Updated Fri 11:53 AM ET · frozen pre-kickoff · Model details · Week permalink
The official player board's top five in passing yards, rushing yards, receiving yards, receptions and anytime touchdown — the same numbers as each game page. Players listed as Questionable, Doubtful or Out are left out; a statistic marked Estimate has not yet met its calibration standard and is labelled so.
Estimate · calibration standard not yet met · The chance of going over a line is not yet well calibrated for this family — read the range, not a precise over/under chance. Evaluation: not cleared on a second review — failed bar: threshold calibration (ECE 0.055 vs 0.05); beats both baselines on typical miss.
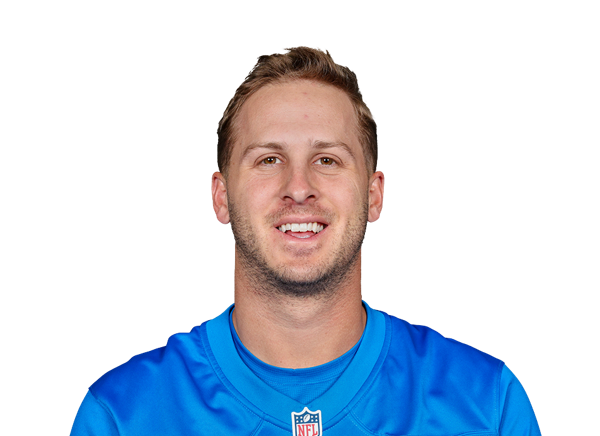 MatchupDET vs MIN · StartSun 1:00 PM ET
 MatchupLAR vs LAC · StartSun 4:05 PM ET
 MatchupCIN vs TEN · StartSun 1:00 PM ET
 MatchupNE vs MIA · StartSun 4:25 PM ET
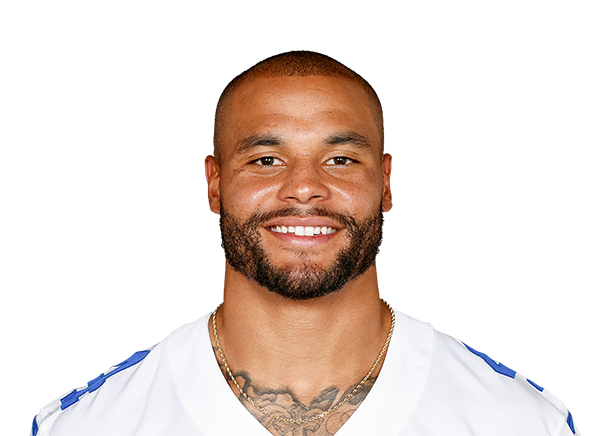 MatchupDAL vs ARI · StartSun 1:00 PM ET
Projected = the official player board's median passing yards; 80% of outcomes fall in the range shown · Official player board
Board stamp
Each one shows what the model said before kickoff, and is labelled with where that game now stands.
NFL schedule as of Oct 30, 11:50 AM ET. Simulations publish inside each game's own window before kickoff, not weeks ahead.
Who our model thinks is most likely to score
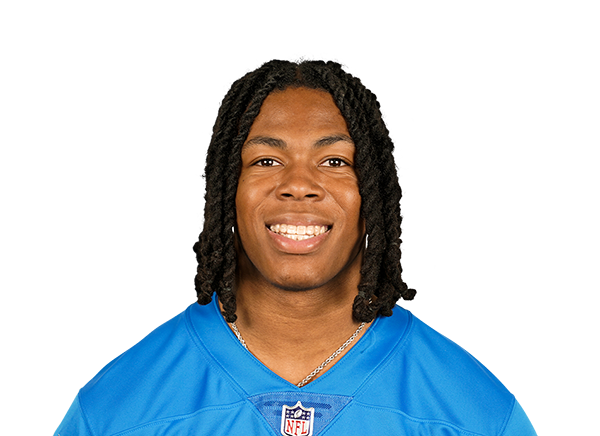 Jahmyr GibbsMatchupDET vs MINStartSun 1:00 PM ETexpected to playMarketNot checkedModelGameTimePicks78.9%Game →
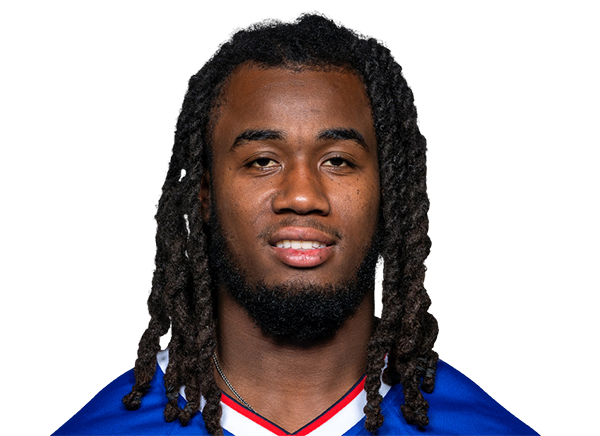 James Cook IIIMatchupBUF vs BALStartSun 1:00 PM ETexpected to playMarketNot checkedModelGameTimePicks76.6%Game →
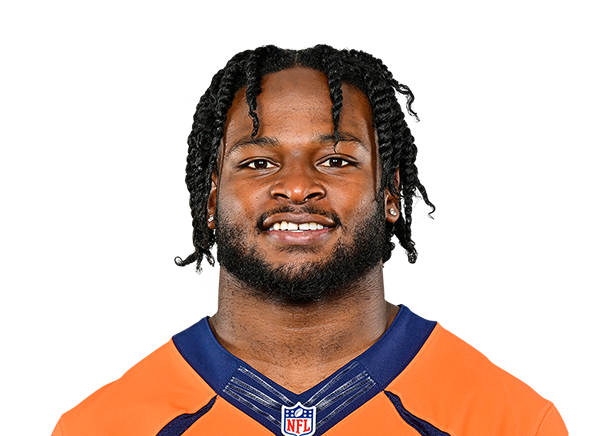 Javonte WilliamsMatchupDAL vs ARIStartSun 1:00 PM ETexpected to playMarketNot checkedModelGameTimePicks73.4%Game →
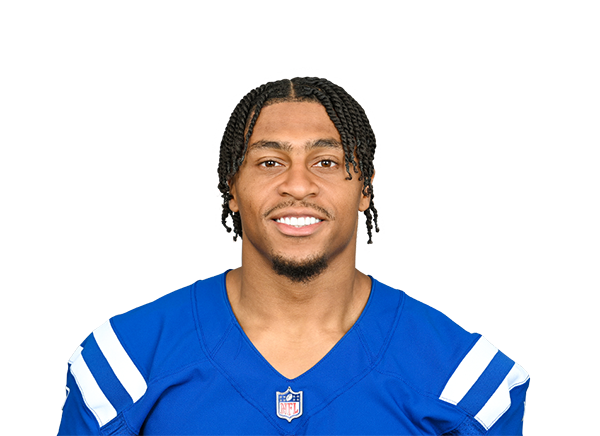 Jonathan TaylorMatchupIND vs JAXStartSun 1:00 PM ETexpected to playMarketNot checkedModelGameTimePicks71.0%Game →
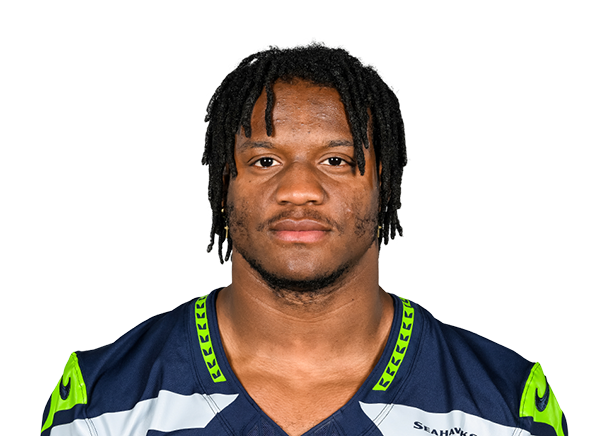 Kenneth Walker IIIMatchupKC vs DENStartSun 4:25 PM ETexpected to playMarketNot checkedModelGameTimePicks69.1%Game →
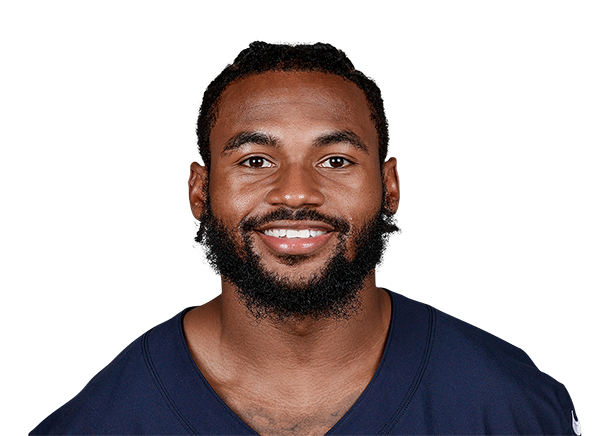 D'Andre SwiftMatchupCHI vs SEAStartMon 8:15 PM ETexpected to playMarketNot checkedModelGameTimePicks66.9%Game →
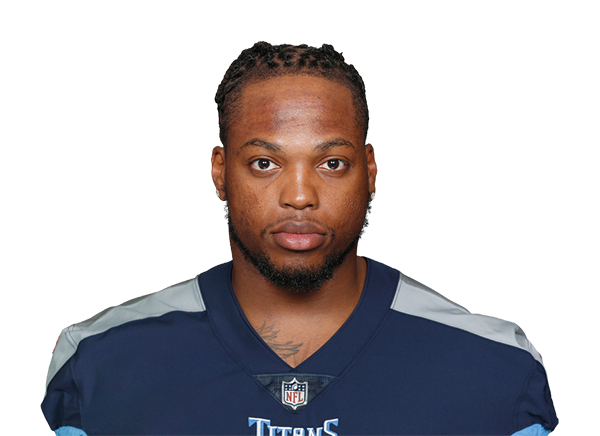 Derrick HenryMatchupBAL vs BUFStartSun 1:00 PM ETexpected to playMarketNot checkedModelGameTimePicks62.1%Game →
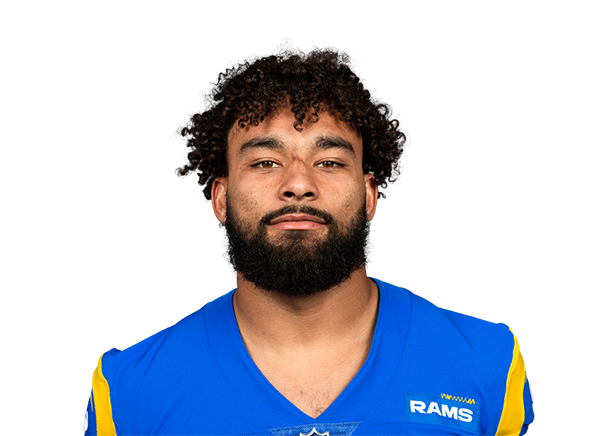 Kyren WilliamsMatchupLAR vs LACStartSun 4:05 PM ETexpected to playMarketNot checkedModelGameTimePicks61.5%Game →
We have not checked the sportsbooks for this market, so we are not showing a price we do not hold.
Sportsbook prices for this slate: none current — last capture Oct 11 ET.
Official final scores. A result we cannot match to a game we listed before kickoff is held back and reported, never graded.
NE 24 — 30 CHIfinal · Thu, Oct 22PIT 16 — 10 NO final · Sun, Oct 25
 SF 20 — 29 ATLfinal · Sun, Oct 25CLE 27 — 24 TENfinal · Sun, Oct 25IND 10 — 16 MINfinal · Sun, Oct 25MIA 28 — 25 NYJfinal · Sun, Oct 25TB 43 — 13 CAR
 final · Sun, Oct 25CIN 35 — 13 BALfinal · Sun, Oct 25
 NYG 27 — 21 HOU
 final · Sun, Oct 25DEN 30 — 16 ARIfinal · Sun, Oct 25
 GB 17 — 20 DETfinal · Sun, Oct 25LAR 35 — 21 LVfinal · Sun, Oct 25KC 3 — 20 SEAfinal · Sun, Oct 25DAL 38 — 21 PHIfinal · Mon, Oct 26CAR 19 — 27 GBfinal · Thu, Oct 29
Game forecasts: the model-favored team (the higher frozen win probability), graded against the official final. This is historical model-favored winner accuracy, not a record of published picks.
147 graded picks is still a small sample. A hit rate over this many outcomes has a wide enough margin of error to be consistent with almost any true accuracy.
EXPERIMENTAL. The NFL team model has not cleared a preregistered bar and is not promoted into any paper product. A tie is recorded as void, not a miss.
| Date | Event | Model said | What happened | Result |
|---|---|---|---|---|
| 2026-10-26 | DAL @ PHI | HOME | AWAY | MISS |
| 2026-10-25 | PIT @ NO | AWAY | AWAY | HIT |
| 2026-10-25 | IND @ MIN | HOME | HOME | HIT |
| 2026-10-25 | TB @ CAR | HOME | AWAY | MISS |
| 2026-10-25 | CIN @ BAL | HOME | AWAY | MISS |
| 2026-10-25 | CLE @ TEN | AWAY | AWAY | HIT |
Showing the 6 most recent of 147 graded.
Every game page prints a margin and a total with an 80% interval. This is how often the real result actually landed inside one, graded against official final scores. Seasons are never pooled.
an interval printed as 80% contained the result only 65.9% of the time over 41 settled forecasts (z -2.26) — the interval is too narrow and the label overstates what the model knows The correction is not applied automatically — changing a model because of a result it has already seen is how a track record stops meaning anything. It needs a preregistered bar and a held-out season first.
Readiness is stated per layer — a page section is never filled merely because it exists.
| Layer | Status | What that means |
|---|---|---|
| Schedule & identities | LIVE | daily capture · 15 events in window, captured Oct 30, 11:50 AM ET |
| Results | LIVE | official finals join by durable event id; results without pre-event schedule lineage are quarantined and say so |
| Team game simulation | Official Forecast | We publish a simulated score range and win chance for every game, published as the Official Forecast (13 games forecast today under nfl-regular-season-public-v1). The win chance comes from a team rating that weights margin of victory. Tested on 4,281 past games it had never seen (2006–2021), it scored 0.629 on log loss (lower is better) against 0.642 for our previous rating, 0.693 for a coin flip and 0.610 for the sportsbooks' own odds — so it makes no claim to beat the sportsbook market. Every forecast is frozen before kickoff and settled against the official result. Next: A validated pick additionally needs the frozen 2026 walk-forward evaluation to pass its own bars — 64 decisive games and 4 completed weeks before any reading counts. |
| Moneyline / spread / total prices | Archived prices | The most recent authorized capture (2026-10-11) priced 14 game(s) whose kickoffs have all passed. Those prices live with their games in the archive; no current price is shown and none is invented. Next: The next authorized market capture. |
| Passing yards | Estimate | not cleared on a second review — failed bar: threshold calibration (ECE 0.055 vs 0.05); beats both baselines on typical miss — the chance of going over a line is not yet well calibrated for this family — read the range, not a precise over/under chance. Next: Current role evidence, a current offered line, and settlement support. |
| Rushing yards | Estimate | eligible for a private test — failed bar(s): calOk — its uncertainty calibration failed the preregistered bar — the range shown may be mis-sized even where the middle is reasonable. Next: Current role evidence, a current offered line, and settlement support. |
| Receiving yards | Published | Every game on this week's slate publishes receiving yards from the same evaluated model. Each game page states its own range. |
| Receptions | Published | Share-level model: cleared every bar when re-tested on 2014–2021 (27,134 player-games) — a second look at seasons examined once before, not a blind test. Each week's forecast is frozen before the first kickoff and graded; its blind 2026 record is holding every bar (1129 graded player-games). |
| Anytime touchdown · Endzone Vault | Published | Every game on this week's boards publishes touchdown chances from the calibrated scoring model; they assume the player plays (a player who does not play settles void). Endzone Vault makes no selection: current role evidence for these games has not cleared its own bar. Next: An offered anytime-touchdown market plus current role evidence. |
| Settlement | DEPLOYED | team and scorer results are graded automatically from official finals; each pre-kickoff forecast settles exactly once when its result exists |
| Paper products · Bank Builder, Moonshot, Card builder | Evaluated · none qualify | 13 pre-kickoff NFL games evaluated; none qualified — the reason is under "Why NFL is not in the paper products" below. |
| Paper products · Endzone Vault | Gated | the Vault reports watchlist only on its own evaluation: 166 model candidates · no current comparable touchdown price is available |
Game-day actives are published about 90 minutes before kickoff; until then availability comes from the injury report.
What we do instead
Each player carries a range of his team's work, not a single number, and the share nobody on the list accounts for is published as unallocated.
Why it matters
A projection is only as good as the playing-time behind it.
Every forecast on this slate was a baseline: the model had no measured read separating the two teams, so these numbers grade a league-average preseason prior, not a game-specific prediction. 6 games. A record this small says almost nothing about a model; it is published because grading every forecast is the only way the numbers stay honest, not because it is evidence of skill.
| Game | We said | Result | Margin off by | Total off by | Inside our range |
|---|---|---|---|---|---|
| DET @ CIN | 19-19 | 14-16 | 2 | 7 | yes |
| GB @ PIT | 19-18 | 9-28 | 20 | 0 | no |
| IND @ NE · tie | 19-18 | 13-13 | 1 | 12 | yes |
| ARI @ LV | 19-18 | 27-14 | 13 | 4 | yes |
| LAC @ HOU | 19-18 | 27-7 | 19 | 3 | no |
| TEN @ SF | 19-18 | 19-13 | 4 | 5 | yes |
Our winner probabilities scored WORSE than the sportsbook consensus (0.2391 vs 0.2237, lower is better) across 5 decisive games.
Win probabilities come from an evaluated strength rating; each game's total comes from that matchup's own scoring ratings.
Who wins, and by how much
This part uses each team's own strength, so it differs from game to game — across this slate our win percentages range from 26.2% to 81.8%.
How many points are scored
This part reads the two teams: each game's total comes from that matchup's own scoring ratings and from how efficiently both offences and defences have played, play by play, updated after every game. Across this slate the published totals span 40 to 55 points. It replaced the earlier totals model after doing better on 5,878 past games (2000–2021) it had never been tested on, under rules written down before the test.
What we found and fixed: An earlier version of this page applied the team-strength input anyway. Because the measured effect pointed slightly the wrong way, it was quietly favouring the WEAKER side in every game. We caught it, tested the input properly, and switched it off.
Every part of this model is re-tested before it changes: a new totals or win model has to do better than the current one on games it has never seen, under rules written down before the test.
All four NFL lanes ran and none produced a card.
| Product | Result | Candidates looked at | Why none qualified |
|---|---|---|---|
| Bank Builder | No qualified card | 13 | 13 × the team model has not cleared its preregistered bar |
| Moonshot | No qualified card | 13 | 13 × the team model has not cleared its preregistered bar |
| Card builder | No qualified card | 13 | 13 × the team model has not cleared its preregistered bar |
| End Zone Vault | No qualified card | 166 | 166 × no NFL player-market price was captured for these games — the market was not checked in this window |
What would change this: the team model is baseline only (the P181 challenger was rejected on bars frozen before it was built); all four player families were rejected on their own frozen bars (P183 Release B); no NFL player-market price was captured for these games — the market was not checked in this window (games probed in this window: 0 of 13).
13 pre-kickoff NFL games were evaluated and none qualified. What would change that:
This evaluation runs on every NFL event window and is recorded, so the answer for any past day stays recoverable. The same gate is enforced in the money path itself — an ineligible sport is refused there too, not merely omitted from the pool.
Official Forecasts and Game Simulations on this page are never presented as picks. Player markets and the Endzone Vault stay gated on their own separate evidence — team readiness never auto-publishes a player market. See methodology and all sports coverage.