
The five most likely home runs today
Each pick carries its own probability and settles on its own — this is a list, not a parlay. A 30% pick that does not land is the model behaving as described.
Most likely to go deep today
The model's five highest home-run probabilities from 422 batter-vs-starter pairings. Each is its own number — this is not a card, and the five are not combined.
2 of these 5 face Aaron Nola — the model reads him as today's most homer-prone start, so the board clusters there on purpose.
- 1
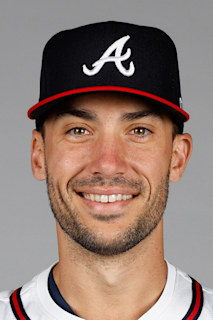 Matt Olson
 vs
vs ATL @ PHI · off Aaron Nola · Citizens Bank Park28.4%
37 HR in 617 plate appearances (6.0% of trips, league 3.0%). Aaron Nola has been more homer-prone than average (32 allowed in 638 batters faced), lifting it to 28.4%.
- 2
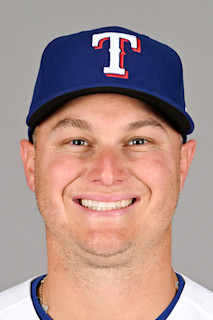 Joc Pederson
 vs
vs TB @ TEX · off Ian Seymour · Globe Life Field23.9%
25 HR in 416 plate appearances (6.0% of trips, league 3.0%). Ian Seymour has been more homer-prone than average (20 allowed in 470 batters faced), lifting it to 23.9%.
- 3
 Munetaka Murakami
 vs
vs MIN @ CWS · off Bailey Ober · Rate Field23.6%
30 HR in 468 plate appearances (6.4% of trips, league 3.0%). Bailey Ober has been more homer-prone than average (18 allowed in 477 batters faced), lifting it to 23.7%.
- 4
 Kyle SchwarbervsATL @ PHI · off Tyler Mahle · Citizens Bank Park23.3%
41 HR in 610 plate appearances (6.7% of trips, league 3.0%). Tyler Mahle sits near league average for homers allowed (17 in 521), so the matchup barely moves it to 23.2%.
- 5
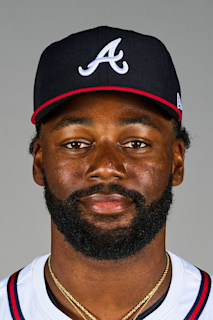 Michael Harris IIvsATL @ PHI · off Aaron Nola · Citizens Bank Park22.4%
24 HR in 542 plate appearances (4.4% of trips, league 3.0%). Aaron Nola has been more homer-prone than average (32 allowed in 638 batters faced), lifting it to 22.4%.
How these are calculated, and what they leave out
Season HR per plate appearance, regressed to the league rate, scaled by the opposing probable starter's regressed HR-allowed rate, over a league-average number of trips to the plate.
League baseline is 3.0% of plate appearances, over 4.21 trips per lineup slot. A batter needs 120 plate appearances to be ranked at all, and every rate is pulled toward the league mean so a hot fortnight cannot top the board on its own.
Not in the model: park factor, weather and wind, batter/pitcher handedness split, batting-order slot (trips to the plate are a league average, not this batter's lineup spot), bullpen faced after the starter leaves.
Settled from official box scores: 13 of 88 graded picks homered against 21.5 expected. No accuracy claim is made at this sample size, and no home-run market price is fetched, so it makes no claim to beat a sportsbook. It is the model's own read, published so it can be measured.
How the number is built
A batter’s home runs per plate appearance, regressed toward the league rate, multiplied by how many home runs the opposing starter allows per batter faced, also regressed. That per-trip rate is compounded over the plate appearances a hitter in his lineup slot is expected to get.
The regression is the load-bearing part. Three home runs in forty trips is 7.5% and almost entirely noise; without a prior pulling it back toward the league rate, a hot fortnight would win a board whose only job is ranking.
Source: MLB Stats API season totals and confirmed probable starters. No sportsbook home-run price is used, so these are not compared to a market number and no edge is claimed.
Track record
13 of 88 picks homered across 20 slates
- 2026-09-050/4 homered
- 2026-09-040/5 homered
- 2026-09-031/5 homered
- 2026-09-020/4 homered
- 2026-09-011/5 homered
- 2026-08-310/5 homered
- 2026-08-302/5 homered
- 2026-08-290/5 homered
- 2026-08-281/5 homered
- 2026-08-270/5 homered
- 2026-08-262/4 homered
- 2026-08-250/4 homered
- 2026-08-240/4 homered
- 2026-08-231/3 homered