
Regular season · week 6 · Thursday, Oct 15, 8:15 PM ET · started
Seattle Seahawks at Denver Broncos
This game has kicked off. Everything below is exactly what was published before kickoff and has not been changed since — that is the point of keeping it.
Live game state
Live betaThe left side is what the live source reports right now. The right side is the GameTime forecast made before kickoff — it is frozen and does not change while the game is played.
Live now
Checking the live feed…
Pregame GameTime · frozen
- SEA
- 19 (42% pregame win chance)
- DEN
- 23 (55% pregame win chance)
Forecast frozen at Oct 15, 8:09 PM ET. It does not change during the game.
Regular season · week 6 · Thursday, Oct 15, 8:15 PM ET · Empower Field at Mile High
Seattle Seahawks at Denver Broncos
 Seattle Seahawks42.3% to win
Pregame projection
19–23
the middle of the outcomes, not a call on the exact final
 Denver Broncos55.2% to win
Denver Broncos were the projected winner, 55.2% to win.
Expected margin
DEN +4
8 in 10 outcomes between -14 and +21
Expected total
42
8 in 10 outcomes between 25 and 60
Model status: Under forward evaluation
These forecasts come from models that passed development tests on past seasons and are now being scored on games played after each forecast was frozen. Until enough of those games are graded, every number here is an estimate, not a validated pick, and none of it is a guarantee. Results are published as games are graded. Player results published so far grade the player-board model's own pre-kickoff ranges, each under the model and version that made it. From Week 5 the game pages and Weekly leaders show World Model V2's passing, rushing and receiving yards and receptions instead; those projections are frozen before every kickoff but are not graded in these results, so none of these results describe them.
No simulation story for this event: No NFL event with a published simulation for this date.
World Model V2 · 10,000 simulated games
Simulated game outcomes
Each simulated game is complete and consistent: the final score, the scoring plays, both offenses and every player line belong to the same game.
Who won the simulated games
SEA 40.1% · DEN 59.7% · went to overtime 3.2% · still tied after overtime 0.1%
This share is counted from the simulated games, which draw the score from the forecast's margin and total; the headline win chance comes from a separate team rating, so the two differ by 4.6 points for DEN.
DEN margin
median +3 · 8 in 10 between -14 and +20
Share of simulated games by DEN margin, in 3-point bands; a minus means SEA won.
Total points
median 42 · 8 in 10 between 25 and 59
Share of simulated games by combined points, in 5-point bands.
How each team scored, on average
| Per game | SEA | DEN |
|---|---|---|
| Points (median, 80% range) | 19 (7–32) | 23 (10–35) |
| Touchdowns | 2.0 | 2.5 |
| Field goals | 1.7 | 1.8 |
| Passing yards | 238 | 213 |
| Rushing yards | 104 | 101 |
Player projections · expected statistical summaries · not one simulated game
What each player is projected to do
Passing, rushing and receiving from the simulated games; anytime touchdown from the touchdown model. Players listed as Questionable or Doubtful are marked; players ruled out are not projected.
 Sam DarnoldQB · SEA vs DEN233yds80%: 135–344
 Bo NixQB · DEN vs SEA209yds80%: 124–308
Projected = median passing yards across the simulated games; 80% of them fall in the range shown · World Model V2 · as of 2026-10-15 23:14 UTC
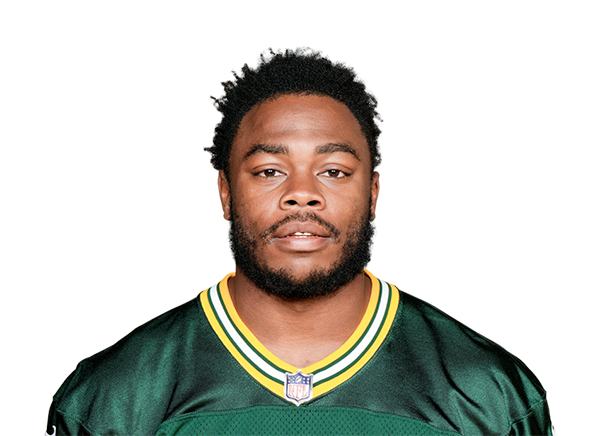 Emanuel WilsonRB · SEA vs DEN58yds80%: 24–106
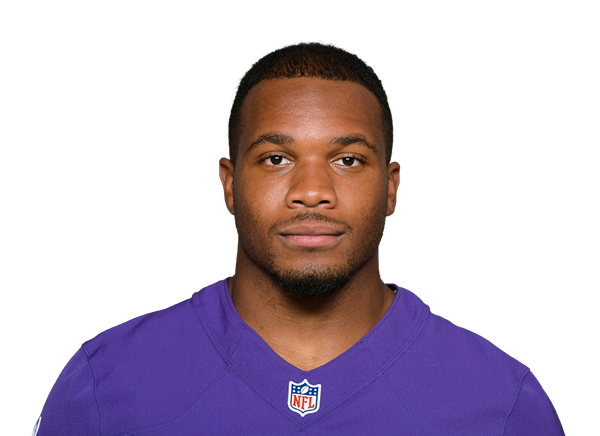 J.K. DobbinsRB · DEN vs SEA45yds80%: 15–92
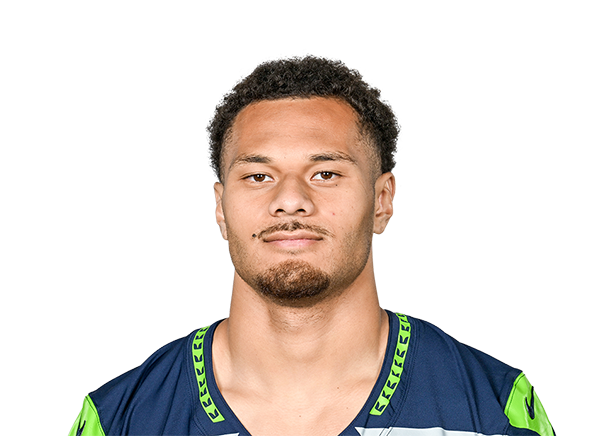 George HolaniRB · SEA vs DEN14yds80%: 0–46
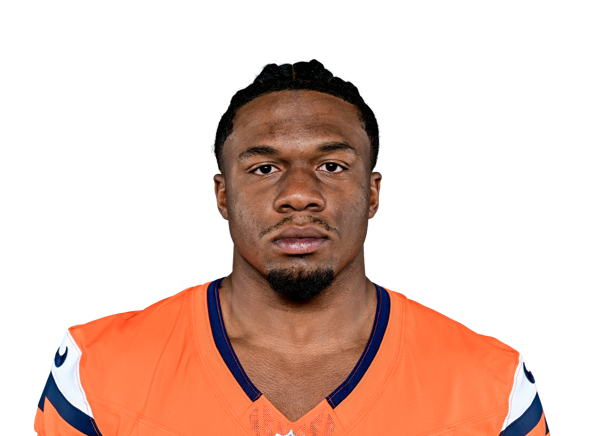 RJ HarveyRB · DEN vs SEA14yds80%: 0–47
- Bo NixQB · DEN vs SEA8yds80%: 0–33
 Jarrett StidhamQB · DEN vs SEA3yds80%: 0–27
- Sam DarnoldQB · SEA vs DEN1yds80%: 0–22
Projected = median rushing yards across the simulated games; 80% of them fall in the range shown · World Model V2 · as of 2026-10-15 23:14 UTC
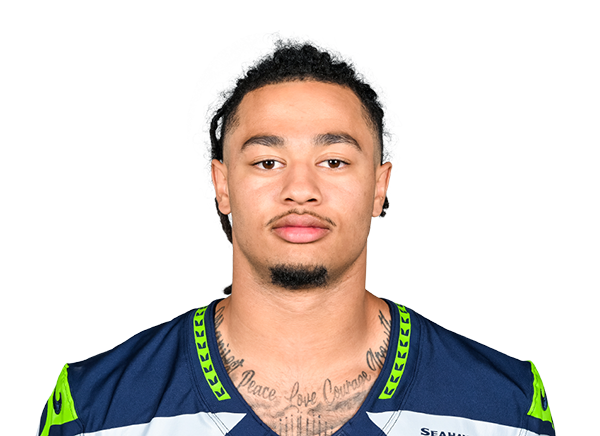 Jaxon Smith-NjigbaWR · SEA vs DEN92yds80%: 30–181
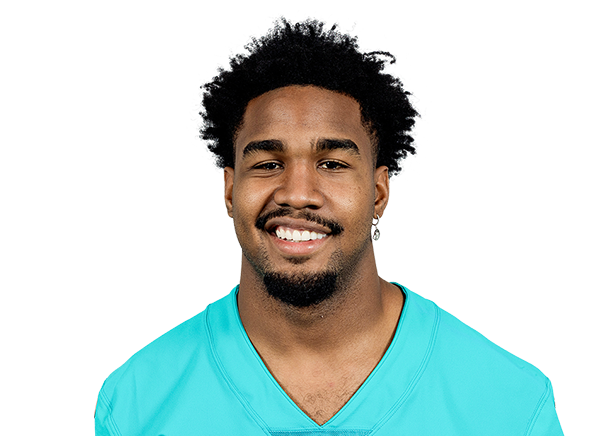 Jaylen WaddleWR · DEN vs SEA38yds80%: 5–94
- RJ HarveyRB · DEN vs SEA26yds80%: 1–72
 Courtland SuttonWR · DEN vs SEA24yds80%: 0–71
 AJ BarnerTE · SEA vs DEN21yds80%: 0–66
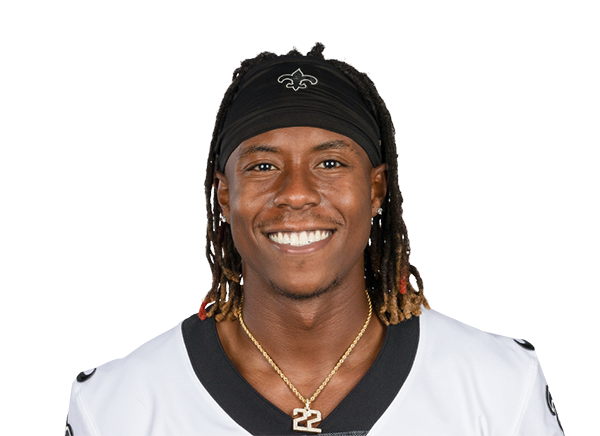 Rashid ShaheedWR · SEA vs DEN20yds80%: 0–66
 Cooper KuppWR · SEA vs DEN19yds80%: 0–67
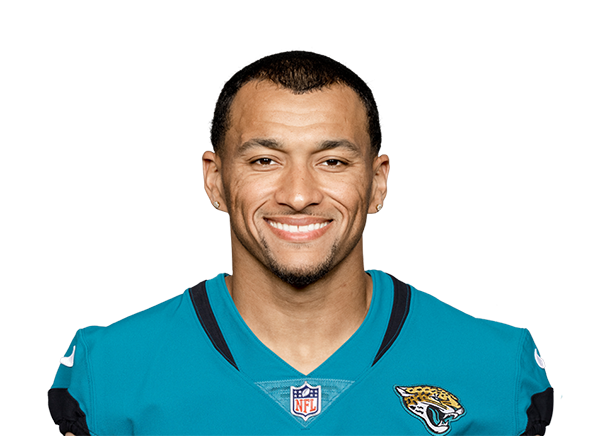 Evan EngramTE · DEN vs SEA18yds80%: 0–64
- George HolaniRB · SEA vs DEN10yds80%: 0–46
 Marvin Mims Jr.WR · DEN vs SEA9yds80%: 0–46
- Emanuel WilsonRB · SEA vs DEN8yds80%: 0–45
 Lil'Jordan HumphreyWR · DEN vs SEA6yds80%: 0–41
 Troy FranklinWR · DEN vs SEA3yds80%: 0–40
 Tyler BadieRB · DEN vs SEA2yds80%: 0–36
- J.K. DobbinsRB · DEN vs SEA0yds80%: 0–31
 Nate AdkinsTE · DEN vs SEA0yds80%: 0–22
 Tory HortonWR · SEA vs DEN0yds80%: 0–33
Projected = median receiving yards across the simulated games; 80% of them fall in the range shown · World Model V2 · as of 2026-10-15 23:14 UTC
- Jaxon Smith-NjigbaWR · SEA vs DEN7.380%: 3–12
- Jaylen WaddleWR · DEN vs SEA3.980%: 1–8
- RJ HarveyRB · DEN vs SEA3.680%: 1–7
- Courtland SuttonWR · DEN vs SEA2.980%: 0–6
- AJ BarnerTE · SEA vs DEN2.780%: 0–6
- Cooper KuppWR · SEA vs DEN2.480%: 0–5
- Rashid ShaheedWR · SEA vs DEN2.480%: 0–5
- Evan EngramTE · DEN vs SEA2.480%: 0–5
- George HolaniRB · SEA vs DEN1.880%: 0–4
- Marvin Mims Jr.WR · DEN vs SEA1.680%: 0–4
- Emanuel WilsonRB · SEA vs DEN1.580%: 0–4
- Lil'Jordan HumphreyWR · DEN vs SEA1.380%: 0–3
- Troy FranklinWR · DEN vs SEA1.280%: 0–3
- Tyler BadieRB · DEN vs SEA1.180%: 0–3
- J.K. DobbinsRB · DEN vs SEA1.080%: 0–3
- Tory HortonWR · SEA vs DEN0.980%: 0–3
- Nate AdkinsTE · DEN vs SEA0.680%: 0–2
Projected = expected receptions (the average across the simulated games); 80% of them fall in the range shown · World Model V2 · as of 2026-10-15 23:14 UTC
- Jaxon Smith-NjigbaWR · SEA vs DEN61.7%chance to score, if he plays
- Emanuel WilsonRB · SEA vs DEN46.2%chance to score, if he plays
- J.K. DobbinsRB · DEN vs SEA34.0%chance to score, if he plays
- RJ HarveyRB · DEN vs SEA29.6%chance to score, if he plays
- Jaylen WaddleWR · DEN vs SEA26.7%chance to score, if he plays
- Courtland SuttonWR · DEN vs SEA22.6%chance to score, if he plays
 Jonah ColemanDEN vs SEA22.5%chance to score, if he plays
- George HolaniRB · SEA vs DEN22.3%chance to score, if he plays
- AJ BarnerTE · SEA vs DEN20.5%chance to score, if he plays
- Rashid ShaheedWR · SEA vs DEN20.2%chance to score, if he plays
- Cooper KuppWR · SEA vs DEN19.7%chance to score, if he plays
- Evan EngramTE · DEN vs SEA15.8%chance to score, if he plays
- Bo NixQB · DEN vs SEA13.2%chance to score, if he plays
- Marvin Mims Jr.WR · DEN vs SEA11.5%chance to score, if he plays
- Tyler BadieRB · DEN vs SEA9.9%chance to score, if he plays
- Lil'Jordan HumphreyWR · DEN vs SEA9.8%chance to score, if he plays
- Troy FranklinWR · DEN vs SEA8.7%chance to score, if he plays
- Jarrett StidhamQB · DEN vs SEA6.9%chance to score, if he plays
- Sam DarnoldQB · SEA vs DEN4.6%chance to score, if he plays
Chance to score at least one rushing or receiving touchdown if he plays — from the published touchdown model, not from the simulated games · Touchdown model · as of 2026-10-16 00:09 UTC
Not published yet. Passing touchdowns are credited to the quarterback in every simulated game, but their distribution has not been evaluated yet, so no projection is published.
Not published yet. First-touchdown odds need the order of scoring plays. Our simulated games record who scored, not in what order, so no first-touchdown probability is published.
Model detail — who this forecast leaves out (5)
- Jadarian Price SEA — Not playing: Listed Injured Reserve.
- Zach Charbonnet SEA — Not playing: Listed Out.
- Drew Lock SEA — Not this team's passer: backup quarterback — the passing projection belongs to the depth chart's starter.
- Jarrett Stidham DEN — Not this team's passer: backup quarterback — the passing projection belongs to the depth chart's starter.
- Pat Bryant DEN — Not playing: Listed Injured Reserve.
Simulated game explorer
Five of the simulated games, as they were generated
Game #9,405 of 10,000 · Middle of the pack
SEA 26–29 DEN DEN win in overtime
SEA 26 (26 in regulation): 3 TD, 2 FG, 2 XP · 13/18 passing for 166 yds · 40 carries for 154 yds
| Player | Passing | Rushing | Receiving | TD |
|---|---|---|---|---|
| Jaxon Smith-Njigba WR | 7-109 | |||
| AJ Barner TE | 2-1 | 2-17 | ||
| George Holani RB | 6-38 | |||
| Cooper Kupp WR | 2-34 | 1 rec | ||
| Sam Darnold QB | 13/18, 166 | 6-25 | 3 pass | |
| Rashid Shaheed WR | 1-2 | 1 rec | ||
| Emanuel Wilson RB | 26-91 | 1-4 | 1 rec |
DEN 29 (26 in regulation): 2 TD, 5 FG, 2 XP · 13/27 passing for 195 yds · 19 carries for 41 yds
| Player | Passing | Rushing | Receiving | TD |
|---|---|---|---|---|
| Courtland Sutton WR | 2-22 | 1 rec | ||
| Tyler Badie RB | 1-5 | |||
| Jarrett Stidham QB | 3-8 | |||
| Bo Nix QB | 12/26, 180 | 2 pass | ||
| Evan Engram TE | 1-12 | |||
| J.K. Dobbins RB | 11-27 | 3-30 | 1 rec | |
| RJ Harvey RB | 5-6 | |||
| Lil'Jordan Humphrey WR | 1-23 | |||
| Jaylen Waddle WR | 4-67 |
A real game from this run, shown as generated. Plays by players outside the named group count in the team line only. Who scored in one game is not a touchdown probability.
Us versus the sportsbooks
two independent reads, shown side by side
No current sportsbook capture covers this game.
Methodology
How these numbers are made
Sources, versions, timestamps and evaluation status
| Number | Model | Version / run | Produced |
|---|---|---|---|
| Win chance, projected score, margin, total | Game Time Forecast | nfl-regular-season-public-v1 | 2026-10-16 00:09 UTC |
| Simulated outcomes, sampled games, passing / rushing / receiving yards, receptions | World Model V2 | 2.2.0 · run 827866722b1dc1d5 · 10,000 games | 2026-10-15 23:14 UTC |
| Anytime touchdown | Touchdown model (player board) | opportunity model | 2026-10-16 00:09 UTC |
The Game Time Forecast rates both teams from past results and play efficiency and produces the win chance and the score centre. World Model V2 simulates 10,000 complete games: each one draws a final score around that centre, splits it into touchdowns, kicks and safeties, gives each offense its passes and carries, and hands those to the players expected to be active — so in every simulated game the passing yards equal the receivers' yards and every touchdown has a ball carrier or receiver. Player projections are counted from those games. From the replay-validated Elo-logistic head, published exactly as evaluated on a held-out 2025 season — no shrink toward 50% is applied, and no claim to out-predict the sportsbook market is made. This game has kicked off: everything shown is the last version produced before kickoff.
Inputs as of: forecast 2026-10-15 23:14 UTC · injuries 2026-10-15 23:14 UTC · rosters 2026-10-15 23:14 UTC · player history through the last completed week (2026-week06-20261013T2020Z.json).
Quarterbacks: SEA Sam Darnold · DEN Bo Nix (depth chart; the first quarterback not ruled out throws).
| Tested on past seasons | Yes | player receptions, receiving / rushing / passing yards from game worlds: development look PROCEED_TO_FORWARD_SHADOW (2022–2025) |
| Frozen before kickoff and recorded | Yes | Week 5 2026 candidates frozen before kickoff (private captures 2026-10-08T18:21Z, T18:27Z) |
| Graded on games played since | Not yet | no graded forward sample yet |
| Eligible for picks products | Not yet | needs forward evaluation against the preregistered bars |
| Promoted as the official forecast | Not yet | the published game forecast remains the forecast of record |
Results: Player results published so far grade the player-board model's own pre-kickoff ranges, each under the model and version that made it. From Week 5 the game pages and Weekly leaders show World Model V2's passing, rushing and receiving yards and receptions instead; those projections are frozen before every kickoff but are not graded in these results, so none of these results describe them.
Not published:
- anytime td: Touchdown scorer probabilities from these worlds failed their evaluation (log loss 0.5138 vs 0.5109 for the red-zone model; calibration error 0.034). Diagnosis: a scorer must touch the ball in the same world, which double-counts opportunity and moves touchdowns from part-time to every-down players. Not published as probabilities; anytime-touchdown chances shown on the site come from the separate touchdown model.
- passing td: Passing touchdowns are credited to the passer in every world, but no evaluation of passing-touchdown distributions exists. Not published as probabilities.
- interceptions, sacks, kicking and defensive player stats: Not simulated.
- First touchdown scorer: needs the order of scoring plays, which the simulated games do not record.
Known limitations:
- Scores come from the published margin and total heads; they do not see injuries or who plays quarterback.
- Simulated final scores do not cluster on 3- and 7-point margins the way real NFL scores do, so exact-score frequencies from these games are not published.
- The win chance here is counted from these simulated games and can differ from the published win chance, which comes from a separate rating.
- Overtime outcomes are drawn from the 2017–2025 record, not simulated play by play.
- Player volume does not yet adjust to an opposing defense beyond the team-level volume fit.
- Red-zone history ends with 2025; 2026 games add no red-zone evidence.
- Plays by players outside the named active set are counted in team totals only.
Availability used: Jalen Milroe (SEA, Out, not simulated); Jadarian Price (SEA, Injured Reserve, not simulated).
20,000 simulated team-games checked for consistency, 0 inconsistent.
Simulation V2 · experimental · separate from this forecast
What these numbers mean
- Projected score
- The middle outcome across every simulated game — not a prediction of the exact final.
- Win chance
- The model's chance for each side to win, from its team-strength rating — not a count of simulated wins. The simulated games show their own win share, and the difference, in Simulated game outcomes.
- 80% range
- Eight in ten simulated games landed inside this band. Real games land outside it too.
- pp (percentage points)
- The plain difference between two percentages. A gap is a difference, not an advantage.
- Under forward evaluation
- Published while its record on games played after each forecast was frozen is still accumulating. Every forecast is frozen before kickoff and graded against the official result.
Where this came from
- model
- nfl-regular-season-public-v1 v2
- simulations
- 10,000
- input hash
- 7bc81be412311308
- generated
- 2026-10-16T00:09:05Z
- kickoff
- 2026-10-16T00:15Z
- state
- SETTLED
Player-family model provenance (3 published)
- Receiving yards: props-v1 evaluation: n=3575, all promotion bars pass
- Receptions: Share-level model: cleared every bar when re-tested on 2014–2021 (27,134 player-games) — a second look at seasons examined once before, not a blind test. Each week's forecast is frozen before the first kickoff and graded; its blind 2026 record is holding every bar (769 graded player-games).
- Anytime touchdown: Opportunity touchdown model: cleared every bar on a blind test of 2014–2021 (35,128 player-games never used to build it). Probabilities condition on playing — a player who does not play settles void. Each week's forecast is frozen before the first kickoff and graded; its blind 2026 record is holding every bar (1018 graded player-games).
Our win chances come from a team rating that weights how decisively teams win. Tested on 4,281 past games it had never seen (2006–2021), it scored 0.629 on log loss (lower is better) — better than our previous rating's 0.642 and a coin flip's 0.693, but short of the sportsbooks' own odds at 0.610. It has NOT been shown to beat the sportsbook market. Where our win and margin ratings disagree on the favourite, the previous rating is used for that game. The 2026 season evaluation still runs under bars frozen in August, so every forecast stays experimental. These ratings are built from results, not from who is playing: they do not know that a starting quarterback has been ruled out. Our player projections do remove players who cannot play; the team win chance beside them does not. We tested whether adding that would help, using perfect hindsight about whether each team's main quarterback actually played — on 855 games from 2023 to 2025 it improved the win rating on average but was WORSE in one of the three seasons, so it did not clear the bar we hold these ratings to and we left the rating alone.
Educational and paper-only — not betting advice.
Other games with a simulation
- HOU @ JAXSunday, Oct 18, 9:30 AM ET
- CHI @ ATLSunday, Oct 18, 1:00 PM ET
- BAL @ CLESunday, Oct 18, 1:00 PM ET
- TEN @ INDSunday, Oct 18, 1:00 PM ET
- NYJ @ NESunday, Oct 18, 1:00 PM ET
- NO @ NYGSunday, Oct 18, 1:00 PM ET
- CAR @ PHISunday, Oct 18, 1:00 PM ET
- PIT @ TBSunday, Oct 18, 1:00 PM ET
- ARI @ LARSunday, Oct 18, 4:05 PM ET
- LAC @ KCSunday, Oct 18, 4:25 PM ET
- BUF @ LVSunday, Oct 18, 4:25 PM ET
- DAL @ GBSunday, Oct 18, 8:20 PM ET
- WSH @ SFMonday, Oct 19, 8:15 PM ET