DEN @ LAC
Denver Broncos at Los Angeles Chargers at SoFi Stadium.

Regular season · week 5 · Sunday, Oct 11, 4:05 PM ET
Indoors — roofed stadium, no weather to report — not used by the model; no weather term enters the numbers below.
Regular season · week 5 · Sunday, Oct 11, 4:05 PM ET · SoFi Stadium
 Denver Broncos63.8% to win
Projected score
21–20
the middle of the outcomes, not a call on the exact final
 Los Angeles Chargers33.0% to win
Denver Broncos are the projected winner, 63.8% to win.
Expected margin
LAC -2
8 in 10 outcomes between -19 and +14
Expected total
41
8 in 10 outcomes between 24 and 58
Likeliest exact final
DEN 20–17 LAC
1.0% of outcomes — exact scores are rare
These forecasts come from models that passed development tests on past seasons and are now being scored on games played after each forecast was frozen. Until enough of those games are graded, every number here is an estimate, not a validated pick, and none of it is a guarantee. Results are published as games are graded. Player results published so far grade the player-board model's own pre-kickoff ranges, each under the model and version that made it. From Week 5 the game pages and Weekly leaders show World Model V2's passing, rushing and receiving yards and receptions instead; those projections are frozen before every kickoff but are not graded in these results, so none of these results describe them.
The left side is what the live source reports right now. The right side is the GameTime forecast made before kickoff — it is frozen and does not change while the game is played.
Checking the live feed…
Forecast frozen at Oct 10, 2:48 PM ET. It does not change during the game.
Denver Broncos at Los Angeles Chargers at SoFi Stadium.
World Model V2 · 10,000 simulated games
Each simulated game is complete and consistent: the final score, the scoring plays, both offenses and every player line belong to the same game.
Who won the simulated games
DEN 55.8% · LAC 44.1% · went to overtime 2.9% · still tied after overtime 0.2%
This share is counted from the simulated games, which draw the score from the forecast's margin and total; the headline win chance comes from a separate team rating, so the two differ by 11.0 points for LAC.
LAC margin
median -2 · 8 in 10 between -18 and +15
Share of simulated games by LAC margin, in 3-point bands; a minus means DEN won.
Total points
median 41 · 8 in 10 between 24 and 58
Share of simulated games by combined points, in 5-point bands.
How each team scored, on average
| Per game | DEN | LAC |
|---|---|---|
| Points (median, 80% range) | 21 (9–33) | 19 (8–31) |
| Touchdowns | 2.3 | 2.0 |
| Field goals | 1.8 | 1.7 |
| Passing yards | 219 | 231 |
| Rushing yards | 103 | 119 |
Player projections · expected statistical summaries · not one simulated game
Passing, rushing and receiving from the simulated games; anytime touchdown from the touchdown model. Players listed as Questionable or Doubtful are marked; players ruled out are not projected.
 QB · LAC vs DEN
 QB · DEN vs LAC
Projected = median passing yards across the simulated games; 80% of them fall in the range shown · World Model V2 · as of 2026-10-10 00:30 UTC
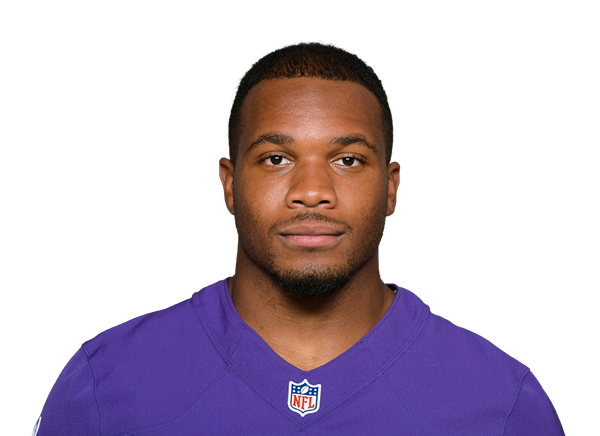 RB · DEN vs LAC
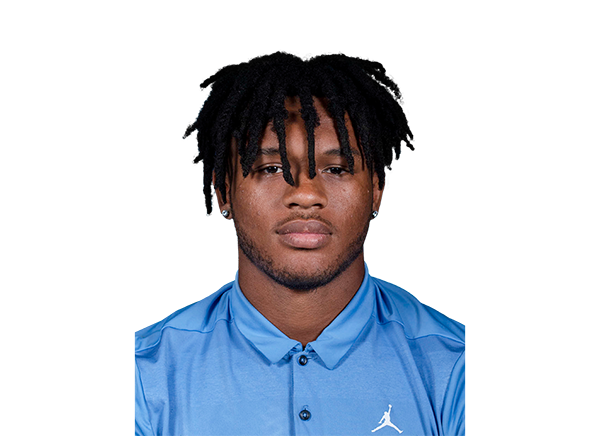 RB · LAC vs DEN
 RB · LAC vs DEN
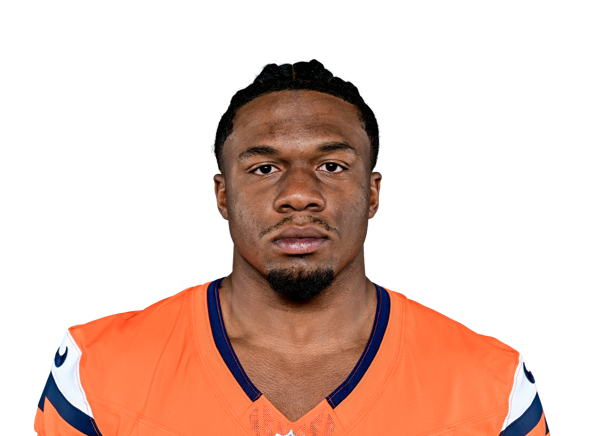 RB · DEN vs LAC
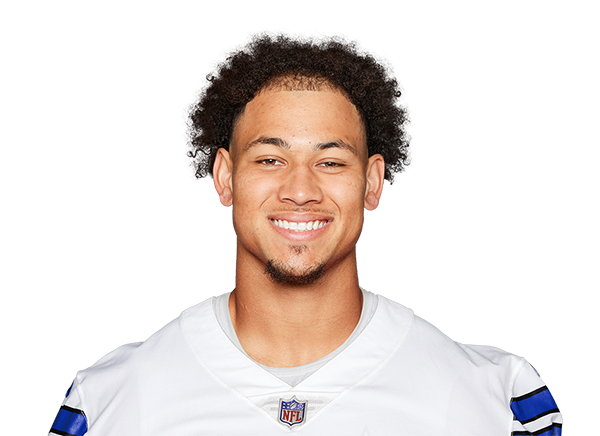 QB · LAC vs DENDoubtfulQB · LAC vs DENQB · DEN vs LAC
 RB · LAC vs DEN
 QB · DEN vs LAC
Projected = median rushing yards across the simulated games; 80% of them fall in the range shown · World Model V2 · as of 2026-10-10 00:30 UTC
 WR · DEN vs LACRB · DEN vs LAC
 WR · LAC vs DEN
 WR · LAC vs DENQuestionable
 WR · DEN vs LAC
 TE · LAC vs DEN
 TE · DEN vs LACRB · LAC vs DEN
 WR · DEN vs LAC
 TE · LAC vs DENQuestionableRB · LAC vs DENRB · LAC vs DEN
 RB · DEN vs LAC
 WR · DEN vs LAC
 TE · DEN vs LAC
 FB · LAC vs DEN
 WR · LAC vs DENRB · DEN vs LAC
 WR · LAC vs DEN
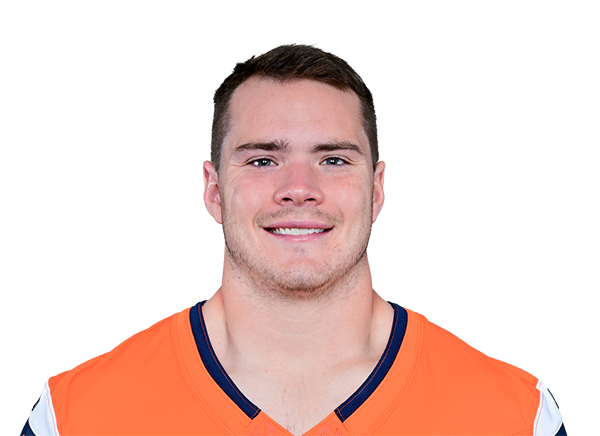 TE · DEN vs LAC
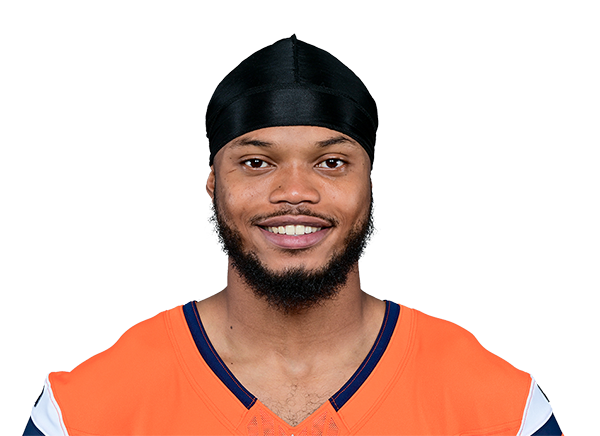 WR · DEN vs LAC
Projected = median receiving yards across the simulated games; 80% of them fall in the range shown · World Model V2 · as of 2026-10-10 00:30 UTC
RB · DEN vs LACWR · DEN vs LACWR · LAC vs DENWR · LAC vs DENQuestionableWR · DEN vs LACTE · LAC vs DENRB · LAC vs DENTE · DEN vs LACWR · DEN vs LACTE · LAC vs DENQuestionableRB · LAC vs DENRB · DEN vs LACRB · LAC vs DENWR · DEN vs LACWR · DEN vs LACRB · DEN vs LACTE · DEN vs LACFB · LAC vs DENWR · LAC vs DENTE · DEN vs LACWR · LAC vs DENProjected = expected receptions (the average across the simulated games); 80% of them fall in the range shown · World Model V2 · as of 2026-10-10 00:30 UTC
RB · LAC vs DENRB · DEN vs LACRB · DEN vs LACWR · DEN vs LACRB · LAC vs DENWR · DEN vs LACWR · LAC vs DENQuestionable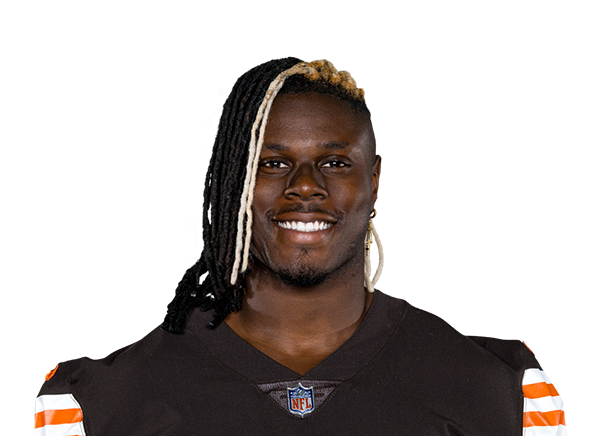 LAC vs DENTE · LAC vs DENWR · LAC vs DENRB · LAC vs DENTE · DEN vs LACQB · LAC vs DENDoubtfulQB · DEN vs LACQB · LAC vs DENWR · DEN vs LACRB · DEN vs LACWR · DEN vs LACTE · LAC vs DENQuestionableQB · DEN vs LAC
Chance to score at least one rushing or receiving touchdown if he plays — from the published touchdown model, not from the simulated games · Touchdown model · as of 2026-10-10 18:48 UTC
Not published yet. Passing touchdowns are credited to the quarterback in every simulated game, but their distribution has not been evaluated yet, so no projection is published.
Not published yet. First-touchdown odds need the order of scoring plays. Our simulated games record who scored, not in what order, so no first-touchdown probability is published.
Simulated game explorer
Game #612 of 10,000 · Middle of the pack
DEN 16–14 LAC DEN win
DEN 16: 1 TD, 3 FG, 1 XP · 21/34 passing for 120 yds · 21 carries for 52 yds
| Player | Passing | Rushing | Receiving | TD |
|---|---|---|---|---|
| Courtland Sutton WR | 1-7 | |||
| Tyler Badie RB | 3-19 | 1 rec | ||
| Marvin Mims Jr. WR | 3-16 | |||
| Nate Adkins TE | 0-0 | |||
| Jarrett Stidham QB | 6-3 | |||
| Bo Nix QB | 21/34, 120 | 1 pass | ||
| Troy Franklin WR | 0-0 | |||
| Evan Engram TE | 4-21 | |||
| J.K. Dobbins RB | 8-29 | |||
| RJ Harvey RB | 7-19 | 2-20 | ||
| Lil'Jordan Humphrey WR | 3-18 | |||
| Jaylen Waddle WR | 5-20 |
LAC 14: 2 TD, 0 FG, 2 XP · 16/26 passing for 211 yds · 38 carries for 186 yds
| Player | Passing | Rushing | Receiving | TD |
|---|---|---|---|---|
| Justin Herbert QB | 16/25, 211 | 5-34 | 2 pass | |
| Ladd McConkey WR | 6-68 | |||
| Kimani Vidal RB | 2-7 | 2-21 | 1 rec | |
| Omarion Hampton RB | 9-53 | |||
| Tre' Harris WR | 3-35 | 1 rec | ||
| Oronde Gadsden TE | 2-43 | |||
| Trey Lance QB | 1-1 | |||
| Alec Ingold FB | 1-20 | |||
| Keaton Mitchell RB | 15-57 |
A real game from this run, shown as generated. Plays by players outside the named group count in the team line only. Who scored in one game is not a touchdown probability.
from an event-based simulation of touchdowns and field goals, solved onto the median margin and total above
| Score (DEN – LAC) | Chance |
|---|---|
| 20–17 | 0.97% |
| 17–20 | 0.82% |
| 24–27 | 0.63% |
| 27–24 | 0.61% |
| 20–23 | 0.57% |
| 20–24 | 0.57% |
No single scoreline is likely — these are the most common of hundreds. The projected score above is derived from the medians and answers a different question: the middle of the distribution, not its most common point.
football's margins pile up on those four — this is the one thing a normal-draw model cannot show you
| Margin | This game | Last 3 regular seasons |
|---|---|---|
| Decided by exactly 3 | 11.2% | 14.2% |
| Decided by exactly 7 | 7.3% | 8.3% |
| Decided by exactly 10 | 6.0% | 4.2% |
| Decided by exactly 14 | 5.2% | 4.4% |
| Any of the four | 29.7% | 31.1% |
The right-hand column is what actually happened across 816 regular-season games (2023, 2024, 2025) — the same finals this engine was fitted to. It gets the shape right, with 3 the most common margin by a distance, and it is not calibrated to the number: it puts less weight on 3 and more on 10 than those seasons did.
two independent reads, shown side by side
Our win chance
33.0%
LAC to win
Sportsbook win chance
37.4%
LAC to win, read from 5 sportsbooks' odds with their built-in margin removed
Difference
-4.4 pp
ours minus the sportsbooks', in percentage points — not a recommendation
Total points: ours vs sportsbooks
41 vs 42
our projected total against the sportsbooks' over/under line
The sportsbook numbers are the books' own, shown for context. A difference is a difference — this model is not validated to out-predict the sportsbook market.
Prices captured 2026-10-10T18:48:02Z — before kickoff.
Methodology
| Number | Model | Version / run | Produced |
|---|---|---|---|
| Win chance, projected score, margin, total | Game Time Forecast | nfl-regular-season-public-v1 | 2026-10-10 18:48 UTC |
| Simulated outcomes, sampled games, passing / rushing / receiving yards, receptions | World Model V2 | 2.2.0 · run ff79498428dac993 · 10,000 games | 2026-10-10 00:30 UTC |
| Anytime touchdown | Touchdown model (player board) | opportunity model | 2026-10-10 18:48 UTC |
The Game Time Forecast rates both teams from past results and play efficiency and produces the win chance and the score centre. World Model V2 simulates 10,000 complete games: each one draws a final score around that centre, splits it into touchdowns, kicks and safeties, gives each offense its passes and carries, and hands those to the players expected to be active — so in every simulated game the passing yards equal the receivers' yards and every touchdown has a ball carrier or receiver. Player projections are counted from those games. From the margin-of-victory Elo win head, published exactly as evaluated on held-out 2006–2021 — no shrink toward 50% is applied, and no claim to out-predict the sportsbook market is made. Until kickoff a later run may update these numbers when an input changes (each version is kept); at kickoff the last version is frozen.
Inputs as of: forecast 2026-10-10 00:30 UTC · injuries 2026-10-10 00:30 UTC · rosters 2026-10-10 00:30 UTC · player history through the last completed week (2026-week05-20261009T0100Z.json).
Quarterbacks: DEN Bo Nix · LAC Justin Herbert (depth chart; the first quarterback not ruled out throws).
| Tested on past seasons | Yes | player receptions, receiving / rushing / passing yards from game worlds: development look PROCEED_TO_FORWARD_SHADOW (2022–2025) |
| Frozen before kickoff and recorded | Yes | Week 5 2026 candidates frozen before kickoff (private captures 2026-10-08T18:21Z, T18:27Z) |
| Graded on games played since | Not yet | no graded forward sample yet |
| Eligible for picks products | Not yet | needs forward evaluation against the preregistered bars |
| Promoted as the official forecast | Not yet | the published game forecast remains the forecast of record |
Results: Player results published so far grade the player-board model's own pre-kickoff ranges, each under the model and version that made it. From Week 5 the game pages and Weekly leaders show World Model V2's passing, rushing and receiving yards and receptions instead; those projections are frozen before every kickoff but are not graded in these results, so none of these results describe them.
Not published:
Known limitations:
Availability used: Quentin Johnston (LAC, Out, not simulated); Ladd McConkey (LAC, Questionable, simulated as playing); Trey Lance (LAC, Doubtful, simulated as playing); Charlie Kolar (LAC, Questionable, simulated as playing); Brenen Thompson (LAC, Out, not simulated).
20,000 simulated team-games checked for consistency, 0 inconsistent.
Simulation V2 · experimental · separate from this forecast
Our win chances come from a team rating that weights how decisively teams win. Tested on 4,281 past games it had never seen (2006–2021), it scored 0.629 on log loss (lower is better) — better than our previous rating's 0.642 and a coin flip's 0.693, but short of the sportsbooks' own odds at 0.610. It has NOT been shown to beat the sportsbook market. Where our win and margin ratings disagree on the favourite, the previous rating is used for that game. The 2026 season evaluation still runs under bars frozen in August, so every forecast stays experimental. These ratings are built from results, not from who is playing: they do not know that a starting quarterback has been ruled out. Our player projections do remove players who cannot play; the team win chance beside them does not. We tested whether adding that would help, using perfect hindsight about whether each team's main quarterback actually played — on 855 games from 2023 to 2025 it improved the win rating on average but was WORSE in one of the three seasons, so it did not clear the bar we hold these ratings to and we left the rating alone.
Educational and paper-only — not betting advice.